Emily Mueller

Emily Mueller

UX Designer & Developer

Turkey Trot STL

Overview

Turkey Trot STL is a local, multi-location 5K race Fleet Feet St. Louis puts on every year on Thanksgiving. The race started with 3 different locations in 2014; Arnold, Eureka, and St. Charles. The race since then has grown to include a fourth location, downtown St. Louis, and due to the COVID-19 pandemic, added a virtual race option.

Originally when this race started, I was Fleet Feet’s graphic designer and had some knowledge of web development. The current site is built using Bootstrap; it was laid out designed using the knowledge I had back then as well as the requests from the race directors and owner of Fleet Feet St. Louis.

Tasks: UX Research, Website Redesign, Icon Design

Design Process

  1. Research
    • Survey
  2. Define
    • Personas
    • Problem Solve
  3. Build
    • Wireframe
    • Prototype
  4. Test
    • Usability Testing

Goal

With the work experience I’ve had since then, I have a much better understanding of UX - and better ideas of how to build a better UI for the end user.

The primary goal of this project is to learn about the end user, people who are interested in running a Thanksgiving turkey trot, provide an accessible way for them to find out more information about the race location they’re interested in, and make a smooth and straightforward way for the user to register for the race.

Research

The original idea was to be able to see users in their own environment interact with the current Turkey Trot STL website as well as other local race websites to see how they navigated and interacted with the website. Due to COVID-19, I was unable to do this due to safety reasons.

Survey

Instead I created a survey with 6 questions to learn more about the end users who would potentially be using the site, their motivations for running/walking a 5K, and how they best navigate through websites as well as their thoughts and opinions on site features and design.

Here’s what I found:

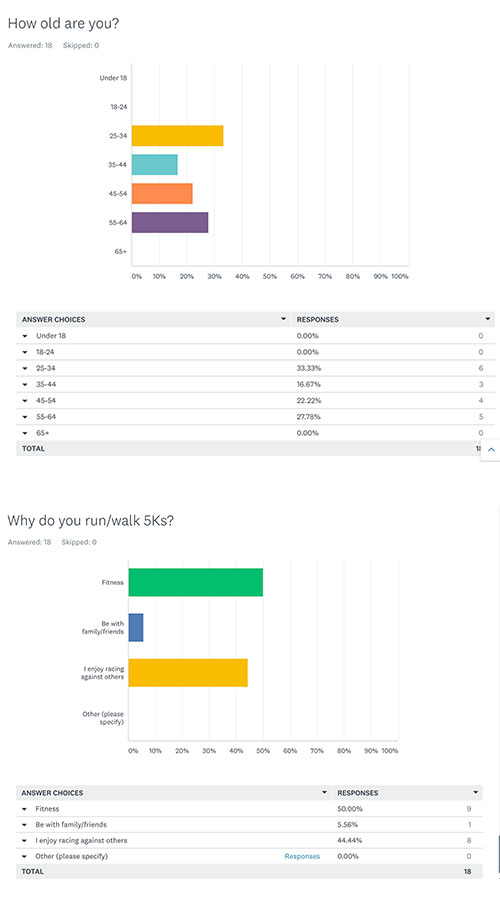
Why do people run/walk 5Ks?
50% of people run races for fitness
44% of people run races to race against others
5% run races to be around family and friends

How old are my survey participants?
33% are 25-34
27% are 55-64
22% are 45-54
16% are 35-44

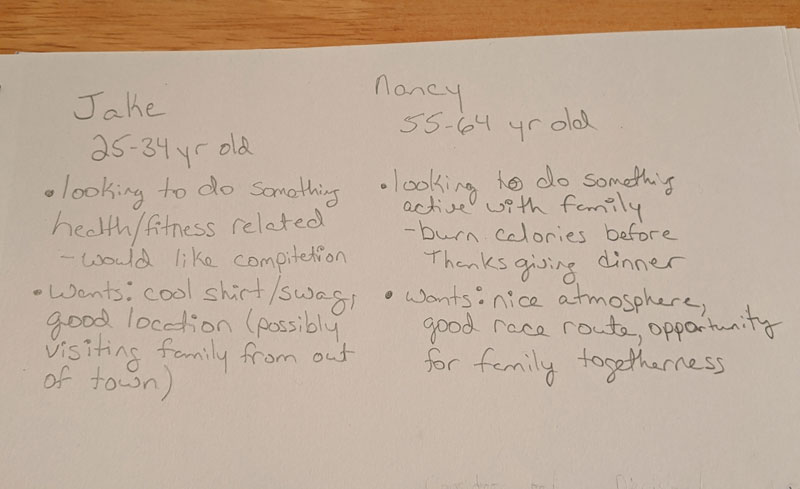
What do people look for in certain 5K races? (Listed in order of importance to user)
Swag (Shirt/medal)
Race Route
Location
Course/crowd support
Other honorable mentions include: fun theme, close to home, atmosphere, supporting a charity, price and accurate timing.

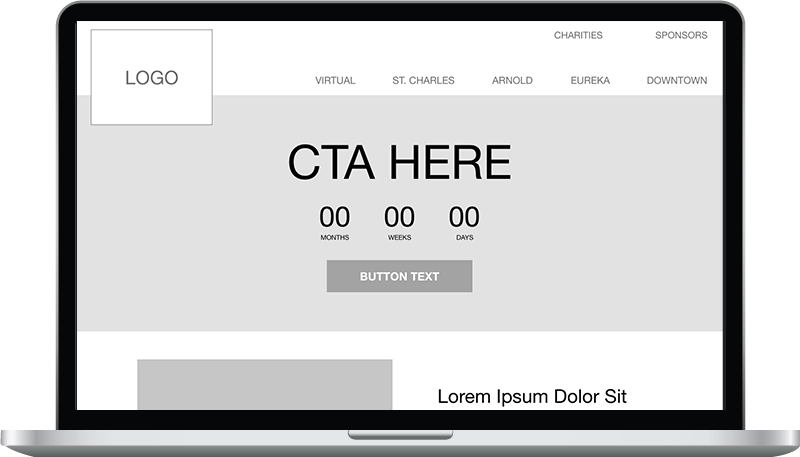
I was also able during this survey to get a better feel from users on how they preferred to navigate through a website using the top navigation in the header. The motto "people prefer less clicks” appeared to be true in this instance, since people preferred the fuller navigation option as opposed to the more categorized approach.

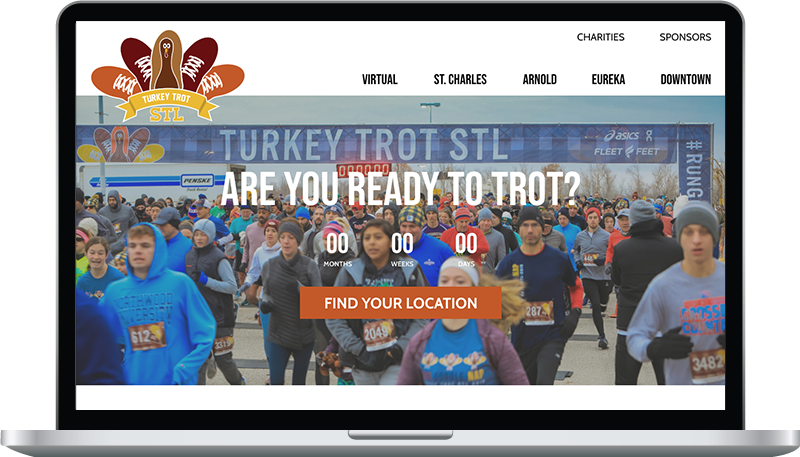
I was also able to find out after asking users what race websites they liked to use, that end users like sites that make it easy to find their race results. Other mentions included organization (easily able to find race location and time), colors and photography.

Define

Personas

After I was able to pin-point my audience age ranges, what and whys they choose to run/walk a particular race and their organizational preferences, I was able to start putting together personas.

Problem Solve

With the two personas created, I thought out how to help both users reach their goal on the Turkey Trot website. I knew from the survey results:

TTSTL persona notes

Build

TTSTL Wireframe preview

View Wireframe

Wireframe

I started off sketching out the solution as a low fidelity sketch, and then became more detailed with a wireframe using Adobe XD. The swag section is at the top of the pages, since a majority of the users find that important when choosing a race Locations was positioned below that, to help the user find a race location that would work best for them and prompt them to register If users scroll near the bottom of the page, then they can view the list of reasons to run a Turkey Trot STL race.

Prototype

Since I created the wireframe in Adobe XD, I was able to create a copy of the wireframe artboard and create the prototype, focusing more on the UI elements.

The color pallet for the website is pulled from the logo I originally created. Photography is used throughout the webpage to show people participating in the race from previous years. The vector based leaves were added to help draw attention toward the Locations Call-to-Action section.

TTSTL Wireframe preview

View Prototype

Next Steps

Testing

When COVID-19 is over, the next steps I would follow would be usability testing; to sit down with a few different users from different backgrounds and age groups and see how they would browse the website. I would have a list of tasks to ask the tester to perform, and would then watch as they interacted with the design.

Contact Me

Email icon emily@iemmueller.com